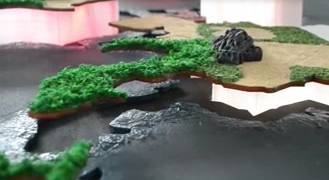
A table of continents is not a misspelling of the word contents. It is, however, a way to physically encode data on a three dimensional map. As can be seen in the video below, there are three ways of encoding data. Trough the height of a continent, the color tone of the continent and the whiteness of the color. For example, the height could be used to indicate the amount of people who own a car in a particular country, while the color could indicate the amount of deaths caused by car accidents. Through physically representing the data, the user can get a better understanding of what the abstract values amount to and intuitively draw better conclusions based on the data.
The table was build in a span of two fulltime weeks with a group of 14-ish people for the Hybrid Worlds project, part of the Creative Technology curriculum. I had never worked in such a big team before so the biggest challenge during this half semester was to manage the project members in a structured way. What we ended up doing was break the team up in three sub-teams of based on discipline. Team one was responsible for the aesthetic design of the table. Team two was responsible for the technical side of the table, including coding and team three was responsible for documentation and user interaction and experience design. Each of the sub-teams had one sub-team-leader. Who was responsible for reporting, managing and overseeing his sub team. At the beginning and end of each day, sub-team-leaders would participate in a scrum like stand-up meeting where progress and complications would be discussed. This system proved very effective and efficient during the project.
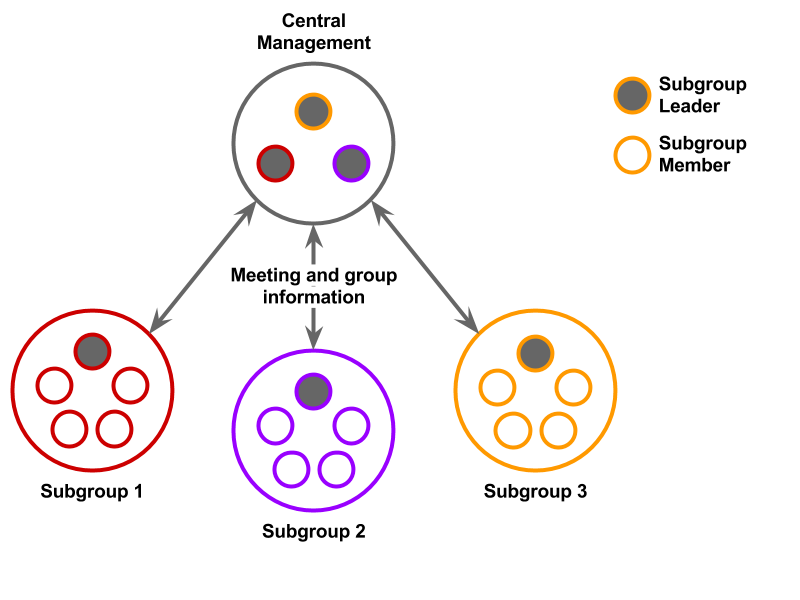
I was responsible for the technical side of the project and thus the sub-group-leader for that team. My role in the project was to oversee technical development and to design, build and program the mechanical arms that were to push the continents up and down. At first I was asked to oversee the whole project, but I did not see how that would work of a team of this size, so I suggested to use the previously mentioned system. Since there was a lot to do, and most of the members had different preferences to do a particular set of tasks, my management role was mostly to notice complications and to keep myself up to date on progress.
Besides management, I started out finding different possible solutions for pushing columns up and down. I considered multiple ways of transforming rotation of an elektromotor into translation of a shaft. Like cam-, crank-, scotch yoke-, gear rack- and gear rack worm mechanisms. At some point I also considered using wires to pull up the shaft. Due to the constraints in materials and limited space available, a simple gear rack mechanism was chosen.
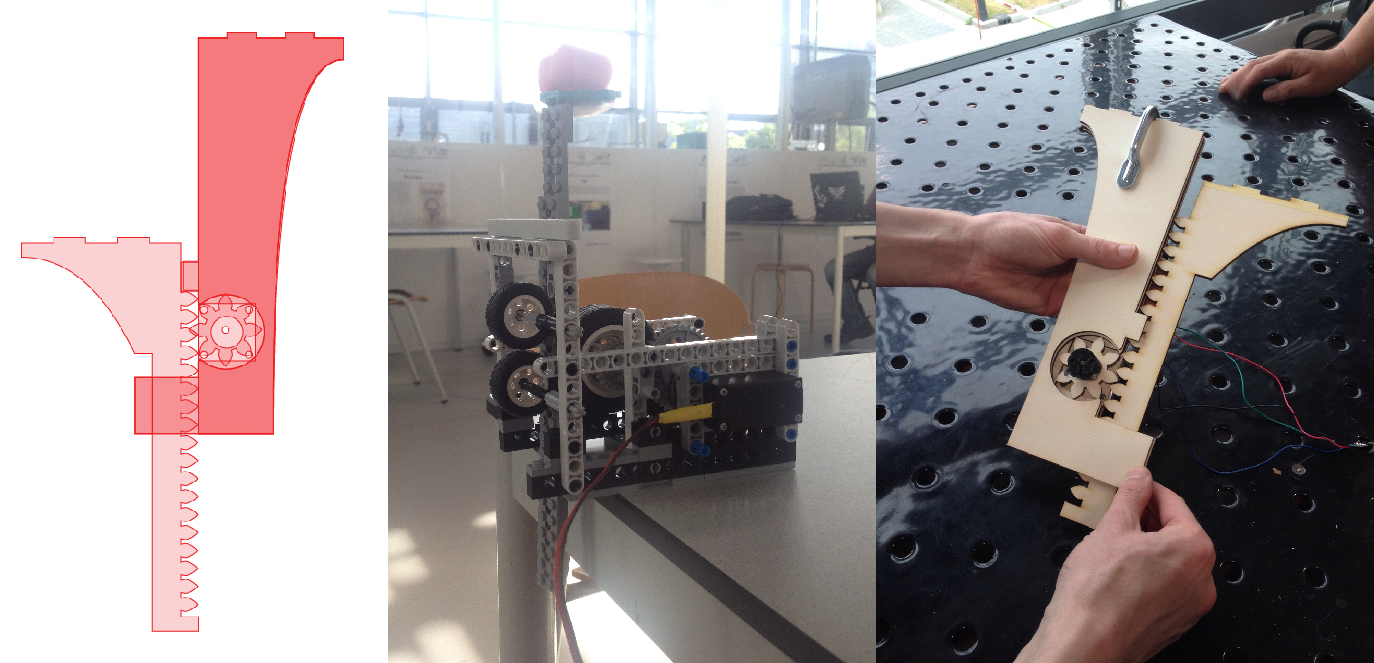
As can be seen from the image, a bunch of prototypes were mande in wood and Lego to test the solution and the required force to move the continents up and down. At first, the stepper-motors (chosen due to their precision) were connected directly to the wooden gears, but they failed to produce enough torque to lift anything at all. The wood also was causing way to much friction with the shaft and stability was also an issue. But due to laser cutting and 3d printing readily available, we were able to solve these issues iteratively. The final product used a 3d printed gearbox and the system was laser cut into plastic. Which made the whole system really work flawlessly, with great precision to boot.
You can see the final results in the video. The table was later bought by the University and is now used during open days and at events to promote the program.